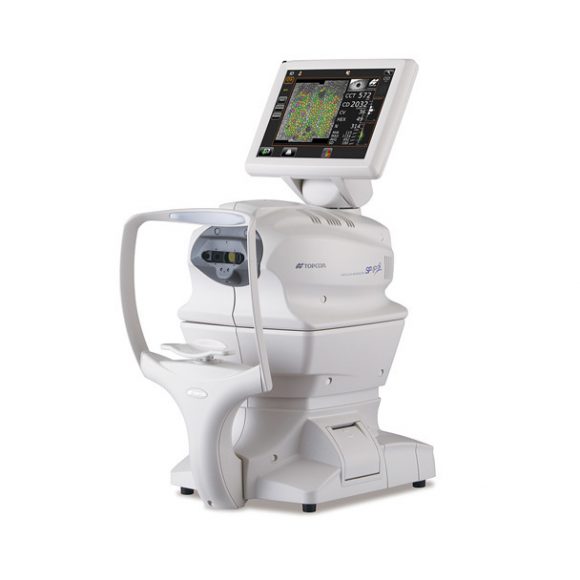
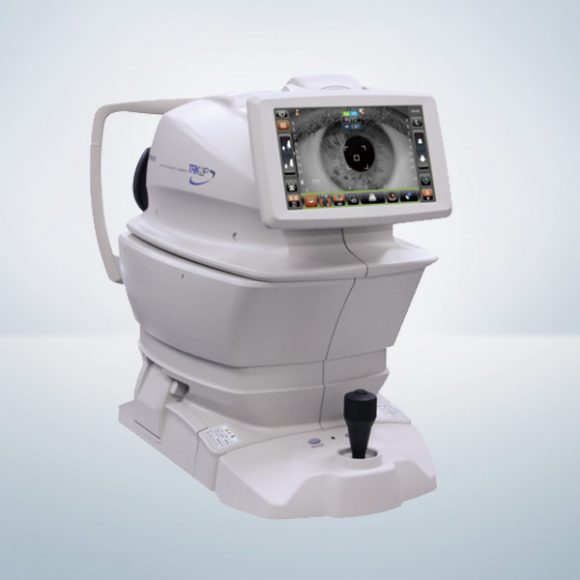
Specular Microscope SP-1P
Product Overview
- Wide Angle “Panorama” Photography Mode
– Substantial size increase of the analyzed area - Two Specific Photography Modes
– Sequence Course & Free Style Course - Quick Automatic Measurement and Analysis
– Instant acquisition of the analysis result – Intuitive operation - Easy-to-Read Screen and Comprehensive Analysis Software
– A pleomorphic / polymegethic histogram can be shown with color
– Frequently referred values are shown on top - Compact and Stylish Design
– 10.4″ rotatable touch panel monitor
Panorama Photography Function


The “Panorama” function takes three images in three different areas: central, nasal and temporal and automatically combines them creating a larger area for the observation and analysis of endothelial cells*. Compared to conventional analysis, this larger area of cells allows for a faster and more complete evaluation of the patient’s endothelium condition. The “Panorama” function is especially useful when the patient cells are decreased and the available number of cells is limited. The increased analyzed cells improve on the reliability of the examination result.
Two Selectable photography modes
Sequence Course

The examiner can enter patient information prior to photographing and then perform the photograph and analysis of the different areas of the cornea. This ensures that all necessary information on the patient is saved.

Immediately after turning on the device, the examiner can start taking pictures. Even during the examination, the examiner can change or add the area to be photographed which allows for a more flexible and quick analysis.
Quick Automatic Measurement and Analysis

The SP-1P photographs and displays analyzed data by simply tapping the screen. All functions, alignment, photograph and analysis are performed automatically.
Comprehensive Analysis Software
All relevant values such as corneal thickness (CCT), cell density (CD), coefficient of variation (CV) and percentage of cell hexagonality (HEX) are displayed in large font size on the top of the measurement screen. By tapping the overlay button at the bottom, the analysis graph can be changed to pleomorphic or polymegethic histogram.


